

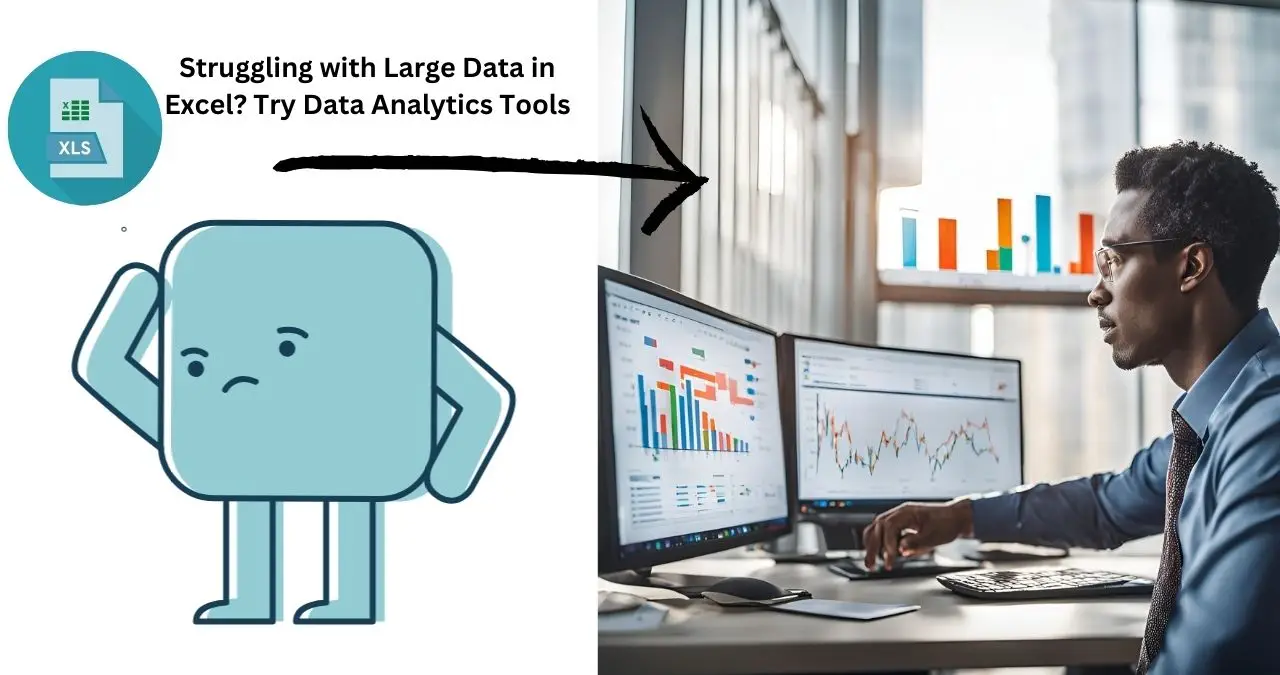
Are you a Business Owner? Struggling to Analyze Your Company’s Data with Excel? Excel is great for small datasets, but it becomes challenging as your data grows. The solution is Modern data Analytics Tools like Power BI, Tableau, or Google Data Studio. Easily integrate data, build interactive dashboards, and get real-time insights. Say goodbye to manual data cleaning and hello to automation!
Ready to transform how your business uses data? Let’s drive growth and efficiency!
In this article, we’ll explore why and how modern analytics tools such as Power BI, Tableau, and Google Data Studio.
Why Excel Struggles with Large Data
While Excel is versatile, it struggles with large datasets. Here’s why:
- Performance Issues: Excel becomes slow or crashes with datasets over millions of rows due to its memory-based storage.
- Complex Data Operations: Handling advanced filtering, aggregating, and calculations with large data is inefficient and prone to errors.
- Limited Visualization: Excel’s basic charts fail to effectively visualize complex data, making interactive reporting challenging.
- Collaboration Challenges: Large Excel files are hard to share and collaborate on in real-time, leading to version control problems.
Enter Modern Analytics Tools: The Smart Solution
To overcome Excel’s limitations, modern tools like Power BI, Tableau, and Google Data Studio are designed for large datasets, interactive visualizations, and enhanced decision-making.
| Features | Power BI | Tableau | Google Data Studio |
|---|---|---|---|
| Cost | Paid, with a free version for individuals | Paid, with a free version for individuals | Free |
| Ease of Use | Moderate, requires learning | Moderate to high, especially for complex tasks | Easy, with drag-and-drop interface |
| Data Handling Capacity | Handles millions of rows, scalable | Handles millions of rows, highly scalable | Handles moderate datasets (depends on Google Sheets/BigQuery) |
| Integration with Data Sources | Excellent integration (Excel, SQL, Azure) | Excellent integration (SQL, cloud, Excel) | Great integration (Google Sheets, Google Analytics, etc.) |
| Advanced Data Modeling | Strong (uses DAX for custom calculations) | Powerful (Calculated Fields, LOD expressions) | Limited (basic calculations) |
| Visualization Types | Wide range, including custom visuals | Extensive (heat maps, geospatial, etc.) | Basic charts, with customization options |
| Real-Time Collaboration | Cloud-based, easy sharing and collaboration | Cloud-based, interactive dashboards | Real-time collaboration, free sharing |
| Predictive Analytics | Limited (some forecasting) | Strong (built-in trend lines and forecasting) | Basic (no native predictive tools) |
| Deployment | Desktop & Cloud | Desktop & Cloud | Cloud-based |
| Learning Curve | Moderate (tutorials available) | High (requires time to master) | Low (easy for beginners) |
| Scalability | Highly scalable | Highly scalable | Less scalable for very large datasets |
Power BI
Power BI is a powerful business intelligence tool that connects to various data sources, models data, and creates dynamic reports:
- Advanced Data Models: Power BI lets you build complex models with custom calculations using DAX.
- Excel Integration: Easily import Excel files and enhance analysis with interactive dashboards.
- Interactive Dashboards: Real-time updates, filtering, and drill-downs allow for deeper insights.
- Collaboration Features: Cloud-based Power BI enables real-time sharing and teamwork on reports, reducing errors.
Tableau:
Tableau is a powerful tool for transforming data into actionable insights, especially for large datasets and complex visualizations:
- Data Blending: Easily combine data from various sources for deeper insights.
- Advanced Visualizations: Create high-quality, customizable charts like heat maps, geographical maps, and treemaps.
- Scalability: Tableau handles millions of rows with ease, whether the data is local or cloud-based.
- Predictive Analytics: Use trend lines, forecasts, and statistical modeling to predict future outcomes.
Google Data Studio:
Google Data Studio is a free, cloud-based tool for data visualization and reporting:
- Ease of Use: Simple drag-and-drop interface to create interactive reports from various data sources.
- Collaboration: Real-time collaboration allows multiple users to edit and comment on reports.
- Customizable Dashboards: Design dashboards with a variety of widgets and charts for easy data visualization.
- Cost-Effective: Free and integrates seamlessly with Google tools, making it ideal for small businesses.
Key Features:
Power BI is best for businesses already using Microsoft tools and seeking deep data integration and advanced modeling.
Tableau excels at complex visualizations and large datasets, making it ideal for data analysts and organizations needing powerful data visualizations.
Google Data Studio is a cost-effective and simple option for small businesses or teams using Google products, offering easy collaboration and real-time updates.
Conclusion:
Excel is great for smaller datasets but falls short with complexity. Tools like Power BI, Tableau, and Google Data Studio unlock the full potential of your data through advanced analytics and interactive visualizations. Don’t let Excel limit your insights—explore these powerful tools today and take your data analysis to the next level!
Ready to unlock the power of your data? Contact us today to learn how our services can help you seamlessly transition to modern analytics tools.